How to use Portfolio Visualizer
What is Portfolio Visualizer?
First of all, I want to note that I have no affiliation with Portfolio Visualizer so hopefully you can trust my review: it's pretty awesome. For the uninitiated, it's a fairly comprehensive suite of investment analysis tools that "investment professionals" used to have to pay thousands of dollars for, but thanks to the interwebs, is now free. In combination with Personal Capital to watch your spending and keep track of your investments, you've got pretty much everything you need to be a "semi-professional amateur" investor like me.
You can backtest any real portfolio or asset class going back in time. It's also possible to compare to another portfolio. Recently, one of my favorite nerd games has been using the back test feature to try to beat the S&P 500 both in absolute return (easy), but also simultaneously see how low I can get the absolute drawdown (much harder...). It's fairly similar to trying to beat it on Sortino ratio (higher=better), which I also try to do of course. Give it a try yourself.
It's a game, but at the same time it's real. Outside of the real estate investment I've spent so much time documenting recently, I've been investing as much money as I can in the stock market. "But valuations are so high!" you might say, and you would be absolutely correct. However, I need to diversify, and this is money I plan on keeping in the market for at least 20 years. I figure if it hasn't appreciated by then, we're all pretty screwed anyway. So far I've tried, and succeeded, not to touch anything I've invested. It's actually not too hard to do. I keep track of my accounts and allocation through Personal Capital, as you can see below, so I know if I need to tinker with anything.
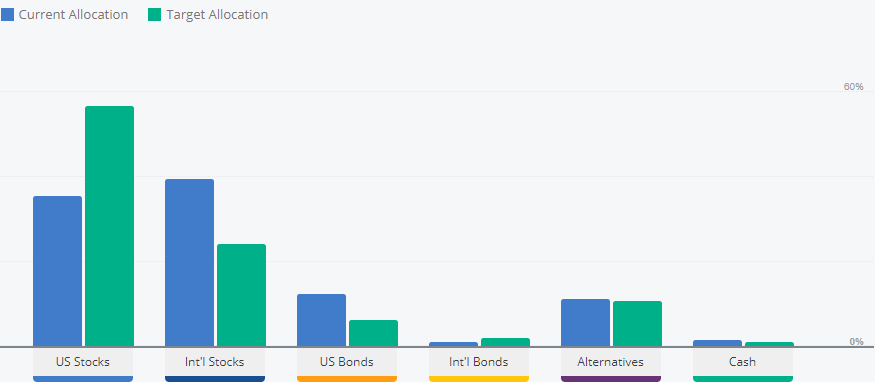
Difference between my portfolio and a "high growth" Personal Capital portfolio
Getting to the point-folio
The point of this post was to tell you how I went about creating my portfolio. In real life, my investments look a lot like this with a couple of tweaks I'll note. It's all index funds following broad market indices, which for me is both safer and less work than building a portfolio of individual stocks.
Besides the goals I mentioned before (general appreciation WITH safety), I also wanted significant exposure to markets outside of the US, Europe and Japan. As these markets start to age, I can see them losing a bit of their steam... or all of it... like Japan.
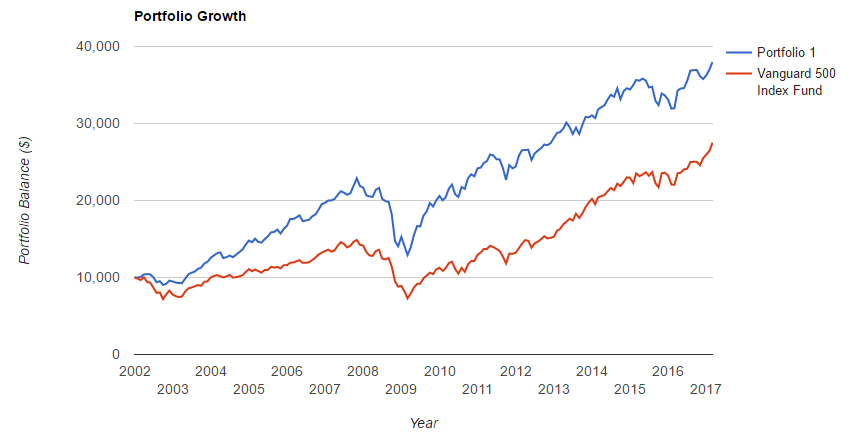
Again, this is comparing to the Vanguard 500 index fund over the past 15 years. Here's the best result I could come up with given those parameters.
The CAGR for my portfolio is pretty near 10%, and the S&P is closer to 6%. Mine has a 43% max drawdown vs. 50% for the S&P 500. If you shift the start date to 2009 the S&P beats it narrowly, but I think the wider view of history is more interesting and indicative of the future anyway.
What's in my Portfolio Visualizer model portfolio?
10% US Large Cap
10% US Mid Cap
10% US Small Cap
10% Developed ex. US Markets
20% Emerging Markets
10% Long Term Treasuries
10% Long Term Corporate Bonds
10% High Yield Bonds
10% REITs
The first thing you'll notice is that almost everything in that portfolio -except for the treasuries, corporate bonds and REITs- are more risky. I have a long time horizon so I'm willing to take a risk, but because all of these assets are less correlated to one another than a portfolio with just the S&P 500, you see less volatile returns anyway. My own portfolio is fairly close to this, although I am trying to find a good commodity producer ETF (preferably ex. oil) that I can add to the mix. I also currently don't own high yield bonds because I think the risk/reward isn't there right now.
I feel pretty strongly about this portfolio. Personal Capital's allocation advisor says I am a little light on US stocks and a little heavy on emerging markets... but that is all in my plan. There's simply more growth potential outside of the US, despite the higher volatility.
I use Personal Capital to track my asset allocation over time for free and make sure that I am invested in the right places.
Anyway, I have a lot more to say, and other lazy portfolio ideas... but can you beat my absolute return and max drawdown numbers in that timeframe with Portfolio Visualizer?


